Practice report: Testing the hackAIR sensors

Figure 1. hackAIR WIFI shield connected to the SDS011 sensor

In spring 2017, a group of engineering students from the Oslo and Akershus University College of Applied Sciences (HiOA) evaluated a first prototype of the hackAIR home sensor and compared the measurements with reference equipment. After overcoming the initial struggle of getting the prototype to work, they conducted two measurement campaigns: one inside the lab environment, and one in the foyer of the school. For that purpose, they also created a 3D-printed case for their sensor.


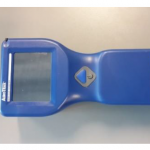
Figure 2. LAS-AIR II
Figure 3. Aerotrak particle counter

Compared to the reference equipment (a LAS-AIR II aerosol particle counter and an Aerotrak particle counter), the students found that measurements differed slightly, though within a reasonable correlation. Increases and decreases in air pollution were picked up correctly. In general, the PM10 measurements turned out marginally less exact as the PM2.5 data.


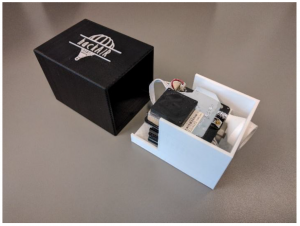
Figure 4. hackAIR prototype case with SDS011
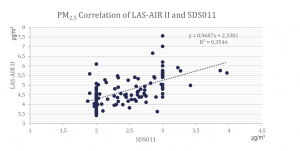
Figure 5. PM2.5 correlation of the LAS-AIR II and SDS011 in the hallway


When using the sensor in the casing, the responsiveness of the hackAIR sensor decreased: That is why the final design of the hackAIR casing will need to ensure proper airflow towards the sensors.

Figure 6.  Measurement devices in the hallway of the first floor in P35 of HiOA

Thanks a million for this exploration, Lisa Marie Rickerts, Carter Barkley, Ryan Beacham & Leyre Ortiz García.

Ensuring quality measurements with the hackAIR sensing toolkit

With hackAIR, you can contribute to better information about air quality in your neighbourhood using a number of different tools. But how good are our data? What can we really say about air quality?

The general principle: official data as a foundation

To calculate the overall air quality map for a city, hackAIR supplements official air quality measurements with user-generated data. The outcome is a continuous map of estimated air quality. Similar to the weather report, we calculate probabilities and estimates for locations in which there are no official measurements. As our models are based on reference measurements, these will always dominate in case they contradict with user-generated data.

When you zoom in to a neighbourhood, you will see the individual measurements that have contributed to the overall estimate – both from official data and other sources.

Sky images to estimate air quality

When you take a picture of the sky, the specific shade of blue you see will vary depending on the air pollution. Using this principle, hackAIR calculates the so-called aerosol optical depth of publicly available and user-submitted images to estimate air quality, taking into account the specific location and time at which the picture was taken. Unfortunately, it is impossible to directly compare these measurements to exact PM10 or PM2.5 values. Instead, the hackAIR app is showing pollution categories (from bad to very good).

  • We mapped the air quality in Thessaloniki using sky photos and we compared these estimations with official measurements in the city. According to the results, our method is able to characterize the aerosol variability within urban centres and identify hotspots.
  • We are currently organising campaigns where we collect a quite big number of sky images taken from different devices so that we examine how the type of the camera affects the quality of the results.

Open hardware sensors

Testing the hackAIR sensors

Both hackAIR open hardware devices use the same component for air quality measurements: The SDS011 sensor. Generally, this component is seen as “the best sensor in terms of accuracy ” for low-cost electronics thanks to its larger fan and laser-based design. However, this does not mean the sensor is as accurate as official reference stations. A scientific evaluation of the SDS011  concluded that measurements are comparable for average humidity – high humidity and temperatures can cause less accurate measurements. The second version of the hackAIR home sensor will thus include a temperature and humidity sensor so that we can balance this effect.

  • The manufacturer of SDS011 sensor, Nova Fitness Co. Ltd., reassured us that the sensor is factory calibrated
  • We have placed some hackAIR sensing devices next to official stations and we are comparing their results.
  • We are testing the validity of the hackAIR sensing devices in laboratories using the Dylos Air Quality monitor.

Update from the hackAIR team (March 2017)

Update from the hackAIR team

Things are moving in the background: the different parts of the hackAIR platform are slowly taking shape, and we’re busy planning for pilots and user engagement. What is happening right now in Thessaloniki, Oslo, Amsterdam, Berlin, Athens and Brussels?

Eleftherios Spyromitros-Xioufis (CERTH)    

“We are working on the image analysis module. We are already processing more than 10.000 images daily – efficiency is a big topic at the moment. We have also started displaying them on a map to see how the data is distributed geographically.”

Ilias Stavrakas (TEI)

“We have completed the communication interfaces for the hackAIR open hardware sensors. Our next step is to make the sensor more user friendly and collect user feedback. We’re also still working on the interface with the smartphone app.”

Ioulia Anastasiadou (DRAXIS)

“We are currently developing and testing the main features of the hackAIR mobile app using the new UI designs. Once this is complete, the same features will be implemented for the web – so that the two of them are in line. At the same time we are integrating the different parts of the system (sensors, fusion, image analysis).”

Paulien Coppens (VUB)

We are further exploring the topics of citizens’  engagement and behavioral change related to air quality. We are now creating specific engagement strategies for hackAIR, for which a literature review on engaging citizens for citizen science has already been done. Next step: conducting expert interviews to learn from other experiences in the field.”  

Philipp Schneider (NILU)

“We are working on statistical methods for combining the observations made by the hackAIR users with other data sources such as those from air pollution models. By doing so, we will be able to offer the hackAIR community spatial information about air pollution, even at locations where no recent measurements are available. The core mapping algorithm has already been developed and we are currently working primarily on the communication interface with our observation database and on testing the method with the first incoming real data.”

Inge Jansen (ON:SUBJECT)

“In the communications team, we are preparing for the launch of the hackAIR platform. This means a lot of internal conversations: What materials do we need? Which audiences do we address first? What is the timeline? In addition, we’re building links with stakeholders and related projects, and happily present this newsletter.”

Arne Fellermann (BUND) 

“Air quality has been a fiercely debated topic in Germany for the first months of 2017. Many German cities, in particular the larger urban regions have problems keeping their air quality limit values. BUND is involved locally in many of the cities in question and also runs a court case against the city of Hamburg for not doing enough to clean the air. hackAIR is a great project to raise awareness and involve citizens, so we can’t wait for the pilot project to happen in Germany.

“With BUND we are currently involved in the national discussion on urban air quality. Many German cities, in particular the larger urban regions have problems keeping their air quality limit values and come under increased pressure by court cases to come up with effective plans to reduce air pollution. In February, the city of Stuttgart, Germany’s air pollution capital with its specific topographic situation and a high volume of motorized traffic in the inner city area, had announced that from 2018 onwards it would only allow the newest EURO6 cars into the inner city, prohibiting access for older cars, whenever there is a so-called “Feinstaubalarm”, and alert for exceedances of particulate matter levels. This alert was introduced in 2016 to create awareness and trigger emergency responses. Two other cities, Düsseldorf and Munich, recently had court rulings requiring them to act within a short time-frame to implement effective measures, including bans of dirty cars. These court orders mean that Germany might see more drastic bans for especially Diesel vehicles. BUND is involved locally in many of the cities in question and also runs a court case against the city of Hamburg for not doing enough to clean the air.”

hackAIR’s social media monitoring tool

Keeping track of conversations and finding good people to follow on social media can be hard. Within hackAIR, this task has now become easier: CERTH has developed an easy-to-use web-based tool that enables real-time monitoring and analysis of a variety of popular social media platforms with open APIs (Twitter, Facebook, Google+, YouTube). This helps us discover online communities and accounts related to air quality and track the impact of our dissemination activities on social media.
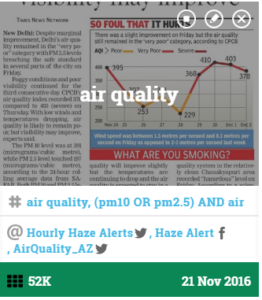
An air quality oriented collection

The tool is configured to keep track of content that is posted around specific keywords and/or accounts of interest. In the context of hackAIR, we use keywords and accounts related to air quality but in principle, the tool can be used to monitor any type of keywords and accounts (e.g. the name of a brand and a number of accounts that often post messages related to this brand). Once specific sets of keywords and accounts (“collections”) have been specified the tool starts pulling related content from the social media platforms on a regular basis (every 15-30 mins) and creates a browsable stream of social media items (“feed”).

The feed view also enables filtering of the items by keyword, source(s) (e.g. show only Facebook and Google+ posts), language, topic (facilitated by text clustering methods), type (media/text) and date range. The items can also be ranked by recency (i.e. the most recent posts first) or popularity (e.g. post with the largest number of shares first). In addition, it is possible to filter redundant items (items with nearly identical content).
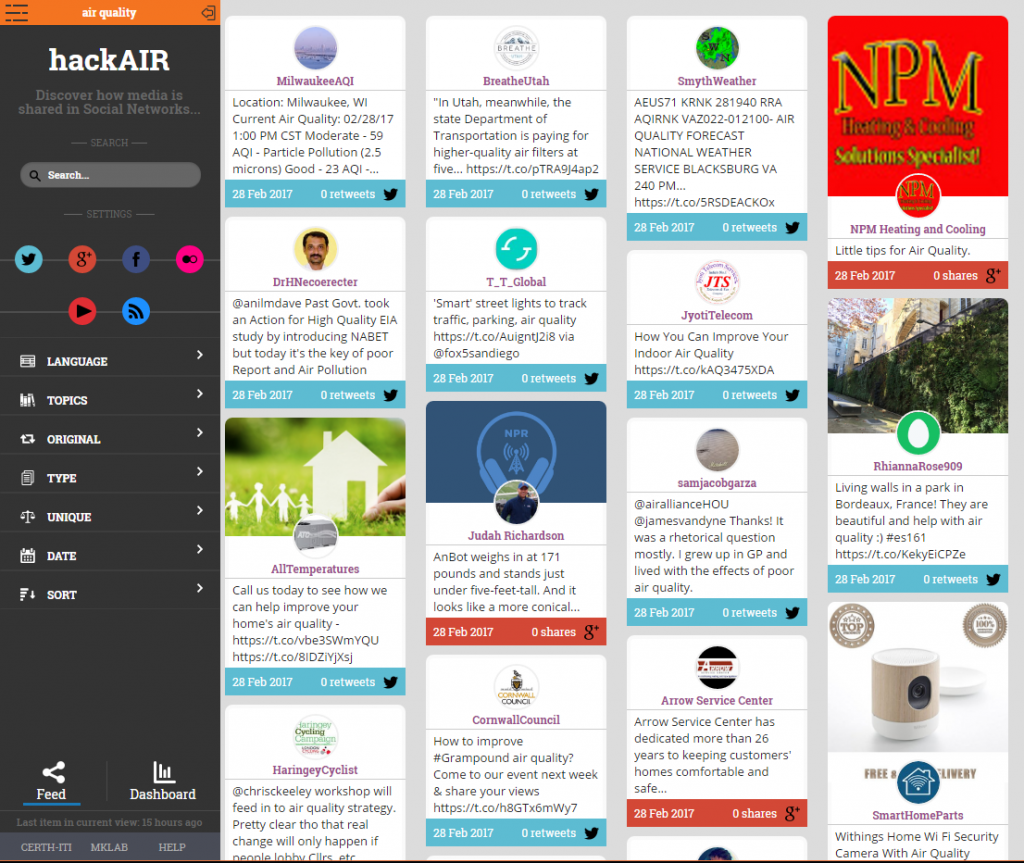
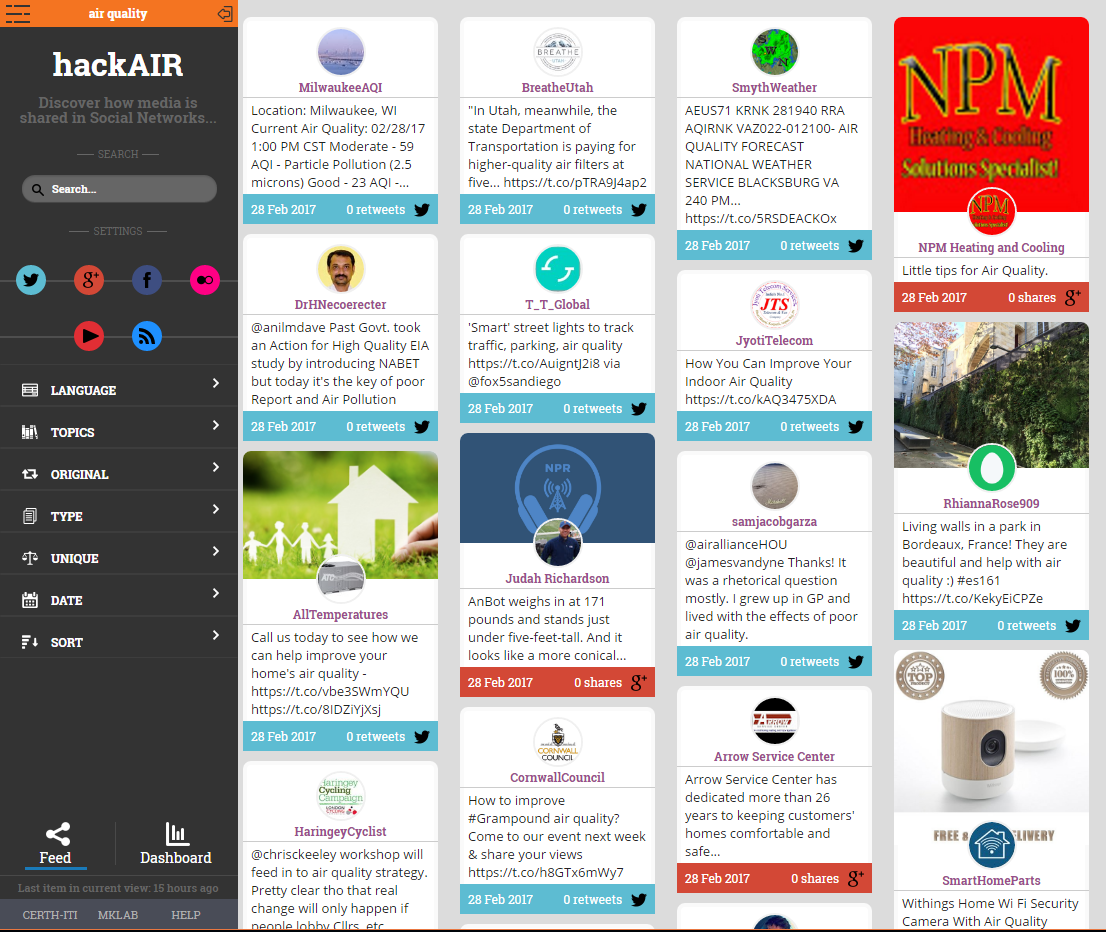
Browsing through a feed of social media posts around air quality

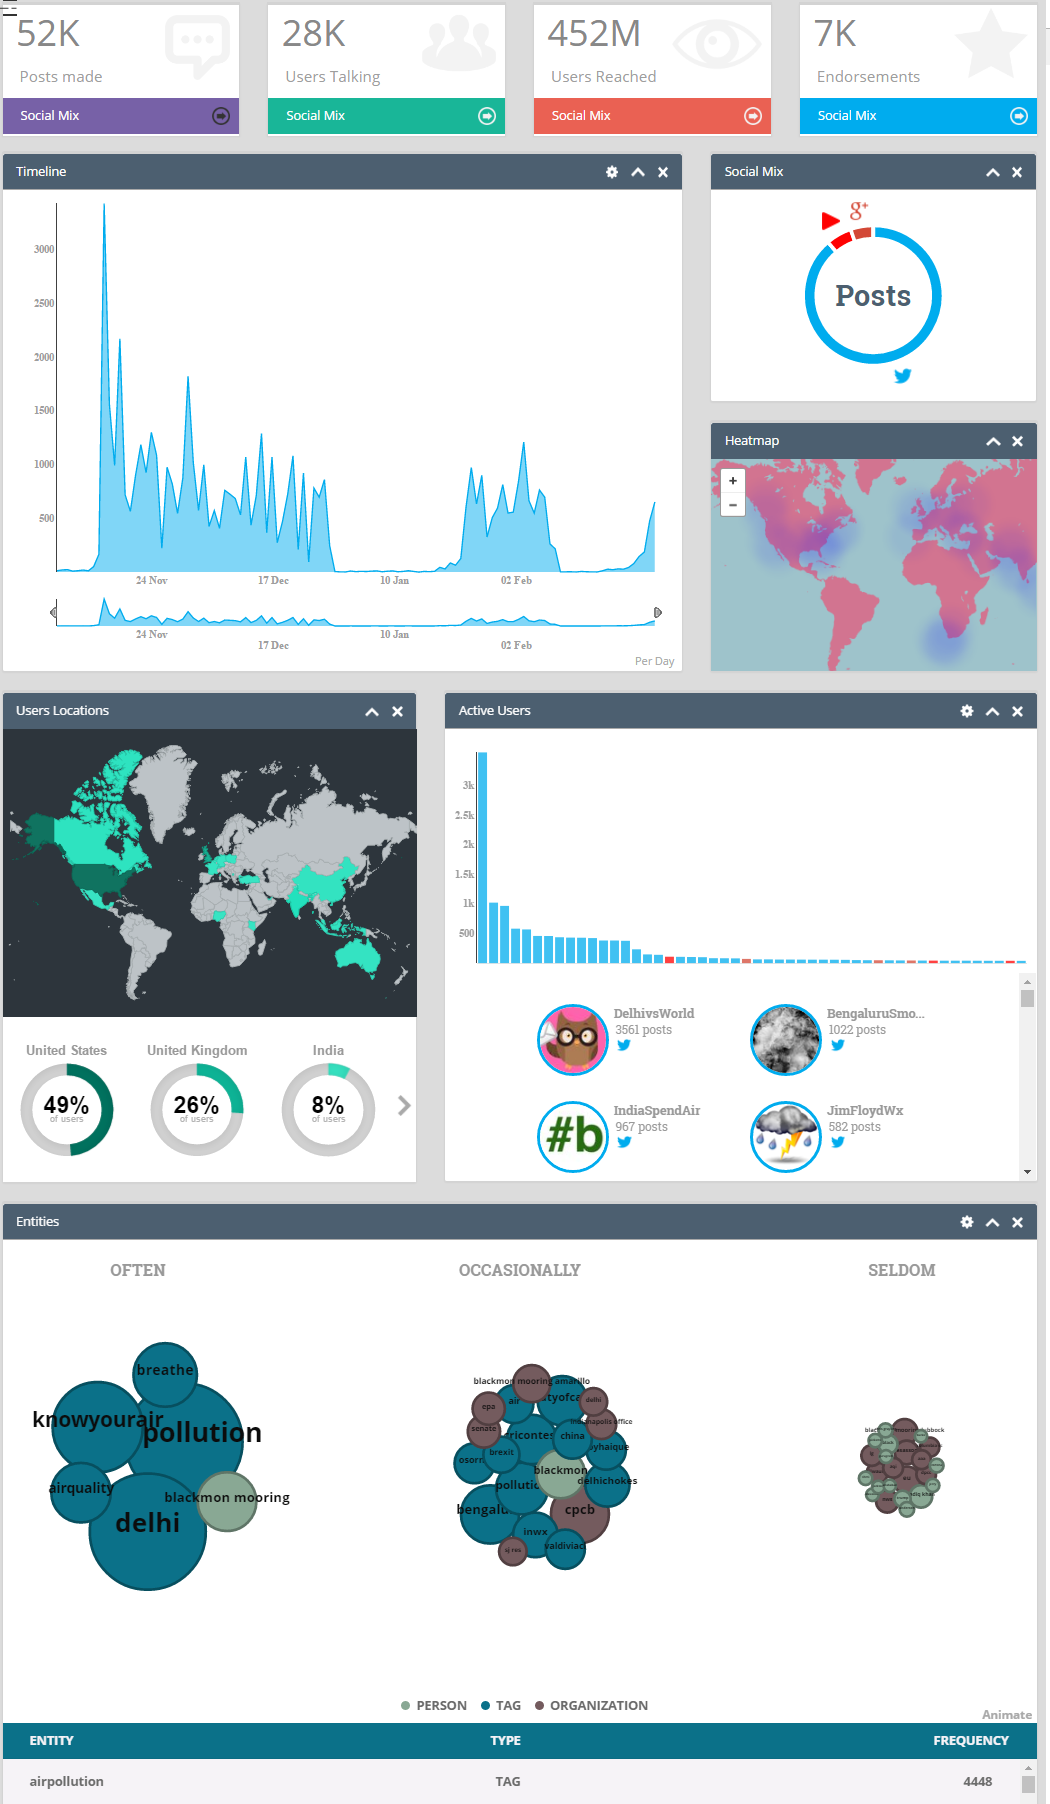
The feed view provides a useful means of discovering trending and popular social media content related to air quality topics and entities. However, the real power of the tool is the capability to provide quantitative views and statistics about the monitored content. This is exposed through the “dashboard” view, which is illustrated below. The dashboard consists of several “widgets”, i.e. visualization elements that depict a specific piece of information in an easy-to-grasp way. The first row of widgets concerns the activity and impact measurement of the monitored topic in terms of activity (number of posts), user base (number of users posting), reach (number of users reached) and endorsement (number of users liking the posted content). Another widget depicts the contribution of each social media source (Twitter, Google+, etc.) to the overall activity about the topic. A timeline widget illustrates the activity around the most important keywords over time. There are also two map widgets: a) a heatmap widget showing the levels of activity across the globe based on the location of geotagged posts (i.e. when users chose to share the location of their posts), b) a world map depicting the location of users (by geo-parsing the location field that users have entered in their public user profile page). Finally, there is a histogram widget that shows the most active users around the topic and a keyword bubble widget that depicts the most important keywords around the topic.

The tool source code is available on GitHub: https://github.com/MKLab-ITI/mmdemo-dockerized.
For more information contact: Manos Schinas (manosetro@iti.gr) or Symeon Papadopoulos (papadop@iti.gr)
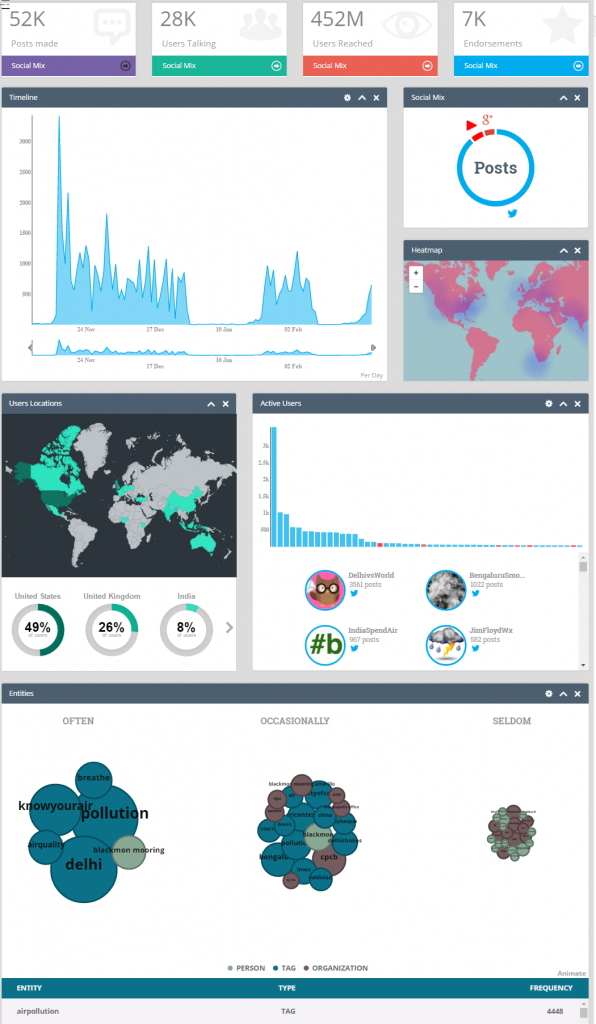
Dashboard offering several statistics and visualizations around air quality.
Dashboard offering several statistics and visualizations around air quality


hackAIR’s social media monitoring tool

Keeping track of conversations and finding good people to follow on social media can be hard. Within hackAIR, this task has now become easier: CERTH has developed an easy-to-use web-based tool that enables real-time monitoring and analysis of a variety of popular social media platforms with open APIs (Twitter, Facebook, Google+, YouTube). This helps us discover online communities and accounts related to air quality and track the impact of our dissemination activities on social media.

The tool is configured to keep track of content that is posted around specific keywords and/or accounts of interest. In the context of hackAIR, we use keywords and accounts related to air quality but in principle, the tool can be used to monitor any type of keywords and accounts (e.g. the name of a brand and a number of accounts that often post messages related to this brand). Once specific sets of keywords and accounts (“collections”) have been specified the tool starts pulling related content from the social media platforms on a regular basis (every 15-30 mins) and creates a browsable stream of social media items (“feed”).


The feed view also enables filtering of the items by keyword, source(s) (e.g. show only Facebook and Google+ posts), language, topic (facilitated by text clustering methods), type (media/text) and date range. The items can also be ranked by recency (i.e. the most recent posts first) or popularity (e.g. post with the largest number of shares first). In addition, it is possible to filter redundant items (items with nearly identical content).


Browsing through a feed of social media posts around air quality


The feed view provides a useful means of discovering trending and popular social media content related to air quality topics and entities. However, the real power of the tool is the capability to provide quantitative views and statistics about the monitored content. This is exposed through the “dashboard” view, which is illustrated below. The dashboard consists of several “widgets”, i.e. visualization elements that depict a specific piece of information in an easy-to-grasp way. The first row of widgets concerns the activity and impact measurement of the monitored topic in terms of activity (number of posts), user base (number of users posting), reach (number of users reached) and endorsement (number of users liking the posted content). Another widget depicts the contribution of each social media source (Twitter, Google+, etc.) to the overall activity about the topic. A timeline widget illustrates the activity around the most important keywords over time. There are also two map widgets: a) a heatmap widget showing the levels of activity across the globe based on the location of geotagged posts (i.e. when users chose to share the location of their posts), b) a world map depicting the location of users (by geo-parsing the location field that users have entered in their public user profile page). Finally, there is a histogram widget that shows the most active users around the topic and a keyword bubble widget that depicts the most important keywords around the topic.

The tool source code is available on GitHub: https://github.com/MKLab-ITI/mmdemo-dockerized.
For more information contact: Manos Schinas (manosetro@iti.gr) or Symeon Papadopoulos (papadop@iti.gr)


Dashboard offering several statistics and visualizations around air quality

Impressions from the Digital Social Innovation Fair 2017

Rome. February 2017. 500 people. 2 days. One big question: How can we embody a human perspective for the next generation internet?

Together with other projects focused on collective awareness platforms for sustainability and social innovation (CAPS), hackAIR participated in the Digital Social Innovation Fair 2017. Our theme: “Collective Sensing and Action”. Sharing a stage with representatives from STARS4ALL, CAPTOR, MAZI and WATIFY projects, Panagiota Syropoulou from DRAXIS presented the latest news from the project and discussed important challenges in engaging users and handling user-generated information.

We also showed an early prototype of the hackAIR Arduino sensor at the event and showed real-time measurements of the air quality of the venue. Visitors showed great interest to build a hackAIR sensor on their own and monitor air pollution. Potential synergies were discussed with representatives of other CAPS projects, such as CAPTOR and EMPATIA.

More about the Digital Social Innovation Fair 2017
Join us at the DSI Manifesto Workshop in Rimini in May 2017.

Copyright 2021. All rights reserved

Take part in this short survey and help us improve your hackAIR experience.