By Wolfgang Röckelein
This post builds on Let’s compare readings from two sensors.
Ok, well done. BUT: this only works for small date ranges, for bigger date ranges you will get timeouts. Therefore, we need a better cache for the API request results. We will use Google Sheets for storing the complete readings of hackAIR home sensors. Google Sheets can also be a Google Data Studio data source. Google Sheets is scriptable and we will use the already well known hackAIR API in a Google Sheets script to regularly update a Google Sheet with the newest sensor readings.
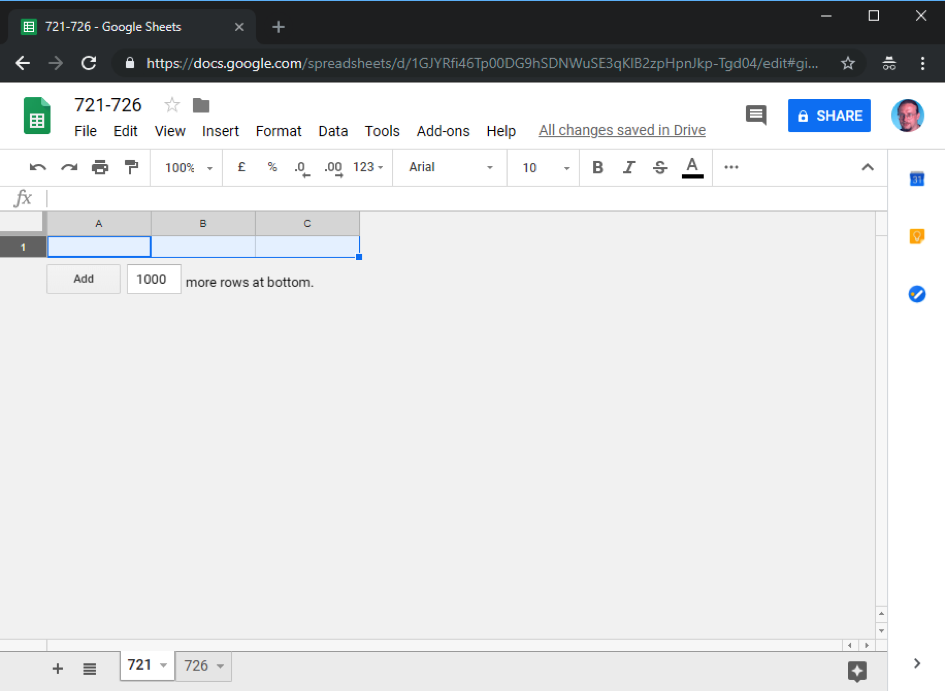
- Start Google Sheets at https://docs.google.com/spreadsheets/ Create a new Spreadsheet and give it a nice name at the top. Use the desired sensor ID as the Sheet name at the bottom. A spreadsheet has a limit of two million cells; each reading takes three cells (datetime, PM2.5, PM10). So better use a separate spreadsheet for each sensor in order not to hit this limit, if you stay inside the limit you could use one spreadsheet with e.g. two sheets one for each sensors.
- Delete all columns except A, B and C in all sheets. Delete all rows except the first row in all sheets. Result should look like this:
- The URL should look like this, record your xyz value.
https://docs.google.com/spreadsheets/d/xyz/edit#gid=0
- We will now use this script to do the initial fill and regular update of your Google Sheets. In your sheet, choose the menu item Tools/Script editor. Give your script a name in the upper left corner (e.g. hackAir) and replace the initial code with the empty myFunction with the code from the link above (click on the Raw button, the use control-a and control-c to copy the code, switch to the script editor and use control-a and control-v to paste the code). Replace xyz in the fourth line with the recorded value from above and replace the date in the third line with your desired start date.
https://github.com/DerGuteWolf/hackair-googlesheets-script/blob/master/Code.gs
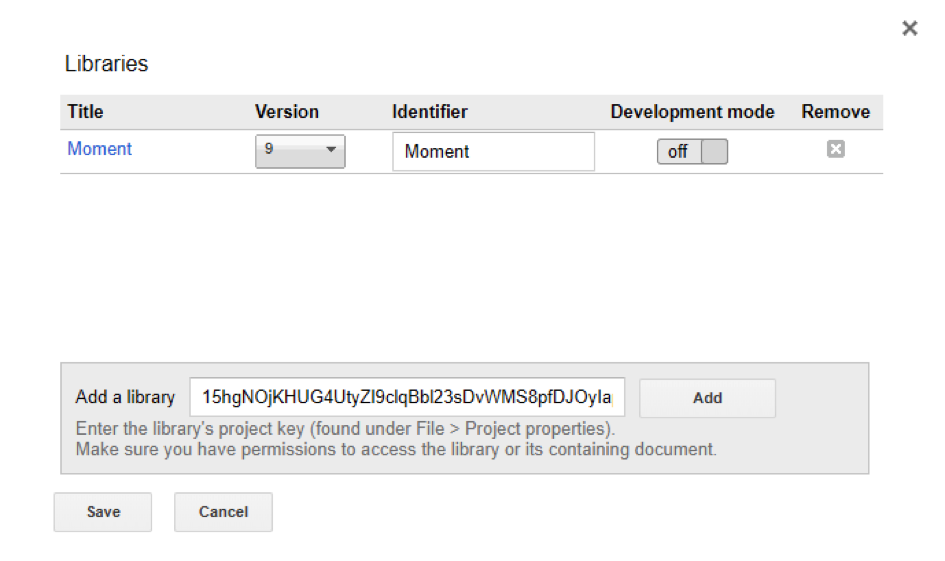
- Choose Menu > Resources/Libraries and add the Moment library by entering 15hgNOjKHUG4UtyZl9clqBbl23sDvWMS8pfDJOyIapZk5RBqwL3i-rlCo and clicking Add. Choose the most current version.
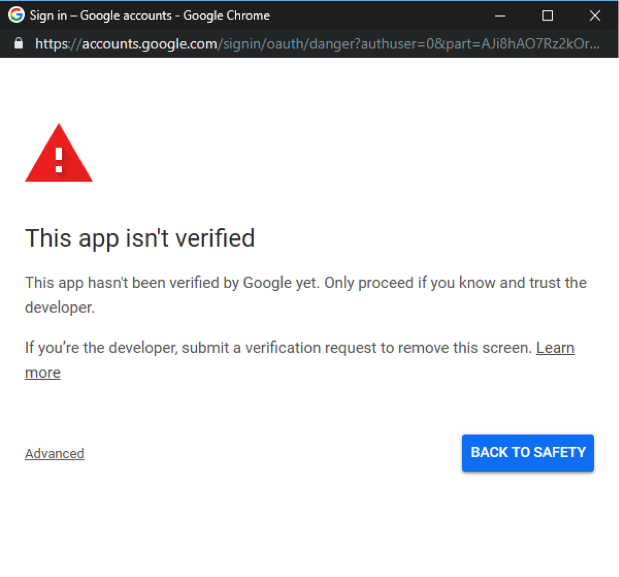
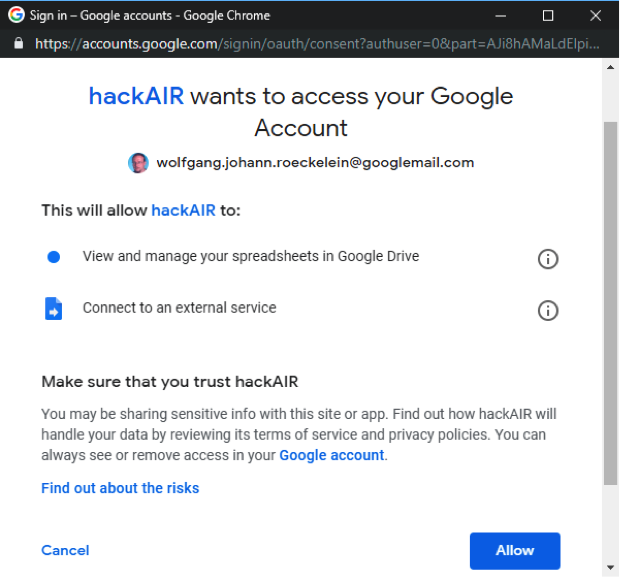
- Click Save to save the script. Execute the script with the run button. Grant the script the permission to access your Google sheet, choose “Advanced” and “Go to hackAIR (unsafe)” and then “Allow”.
- Be prepared that this will take some time (as I already wrote one call per day and sensor and a single call takes a while)! You might need to run the script more than once because of timeout problems. At the end all of your sheets should contains datetime values and sensor readings from the date entered up to the current day.
- To schedule the script to run regularly choose menu entry Edit/Current Script’s Triggers. Click the link to add a trigger:
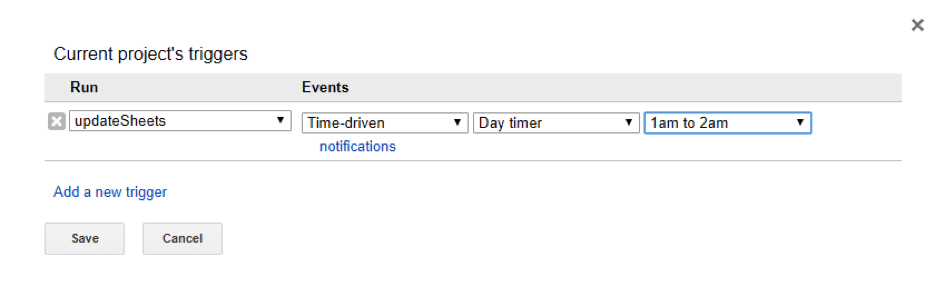
- Click Save. With this setting the sheet will auto-update itself each night.
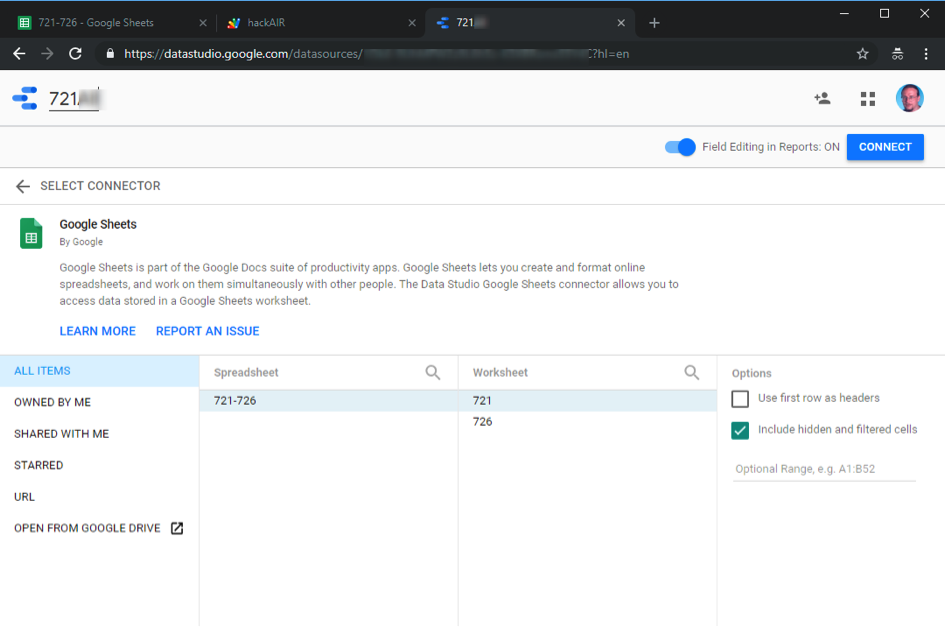
- Go back to your data sources of Google Data Studio (https://datastudio.google.com/navigation/datasources?hl=en). Click on the plus button in the lower right and select the Google Sheets connector. Choose your Spreadsheet and the first sheet. Deselect “Use first row as header” and name your data source in the upper left.
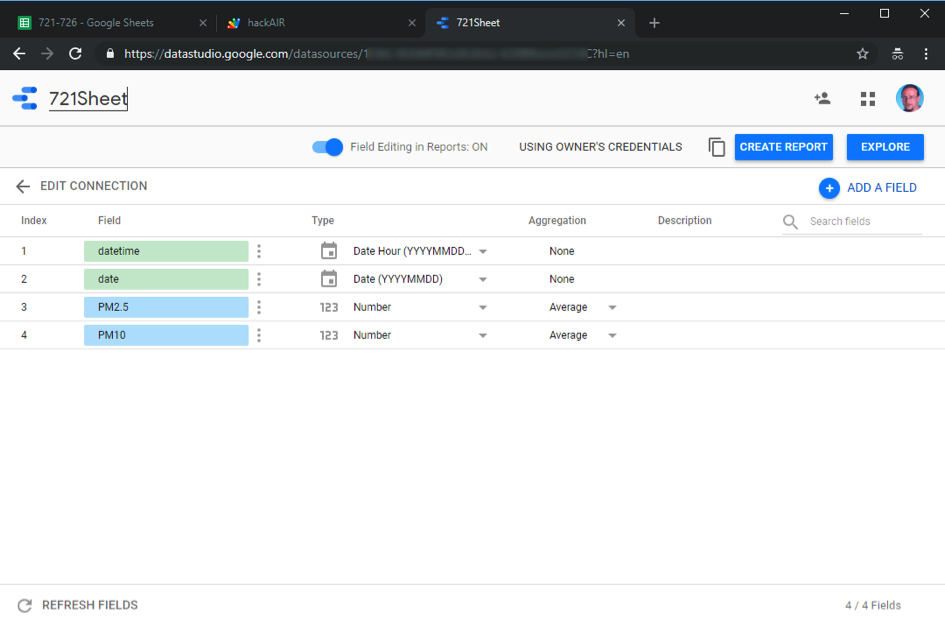
- Click Connect. Duplicate the first field (with the three dots menu next to the name). Name the first field datetime and choose Date Hour as type. Name the second field date and choose Date as type. Name the third field PM2.5 prefixed by the sensorid and choose Average as the Aggregation. Name the forth field PM10 prefixed by the sensorid and choose Average as the Aggregation.
- Click on the Icon in the upper left and do the same for the other sensor. Click on the Icon in the upper left, click on reports on the left, and select the report created above. Click Edit and choose Page/New page. Click on the Time series Icon and create a big chart. Remove the default data source and add first our Dummy data source from above. Add a date range control and choose e.g. “This year to date” as the default value. Click on the chart and then on Blend Data.
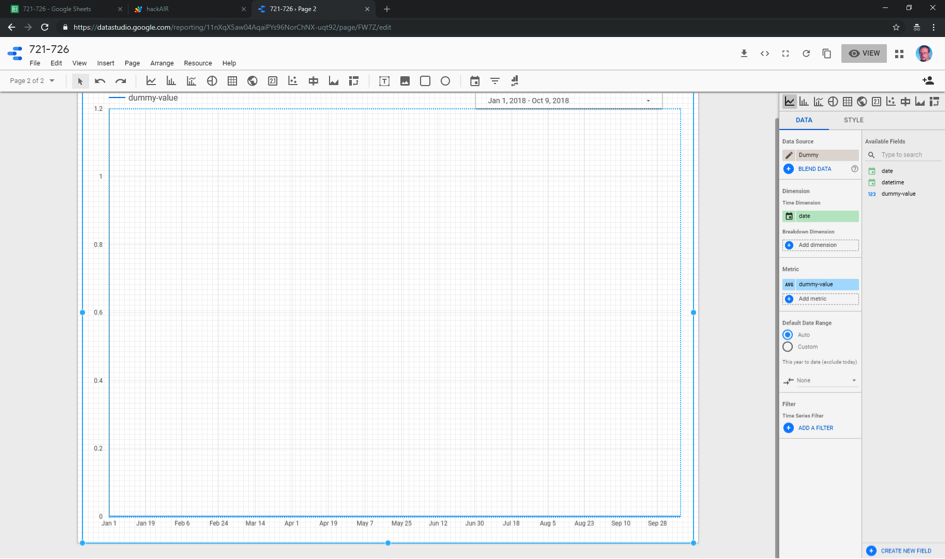
- Use only datetime field from the Dummy data source, select Auto for Date range and add our new sheets data sources. Add the PM fields of each data source:
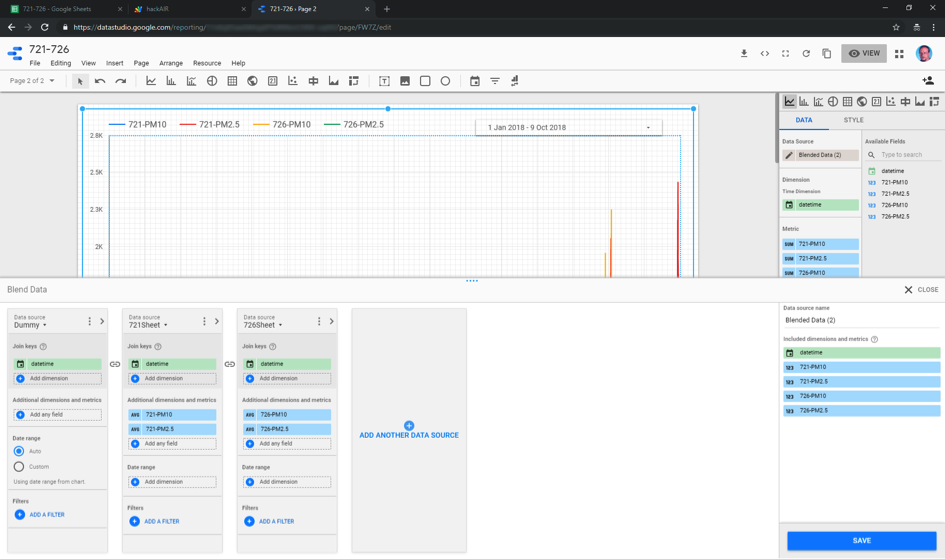
- You could again give your data blend a name. Click Save and click Close. Click View to experiment with the date range.
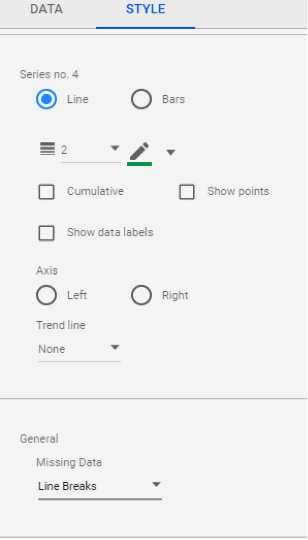
- Unfortunately, for both pages when the first added data source has no values, the values from the second added data source shows no values. To see this better, click on the chart and select theme on the right and set General-Missing Data to Line Breaks.
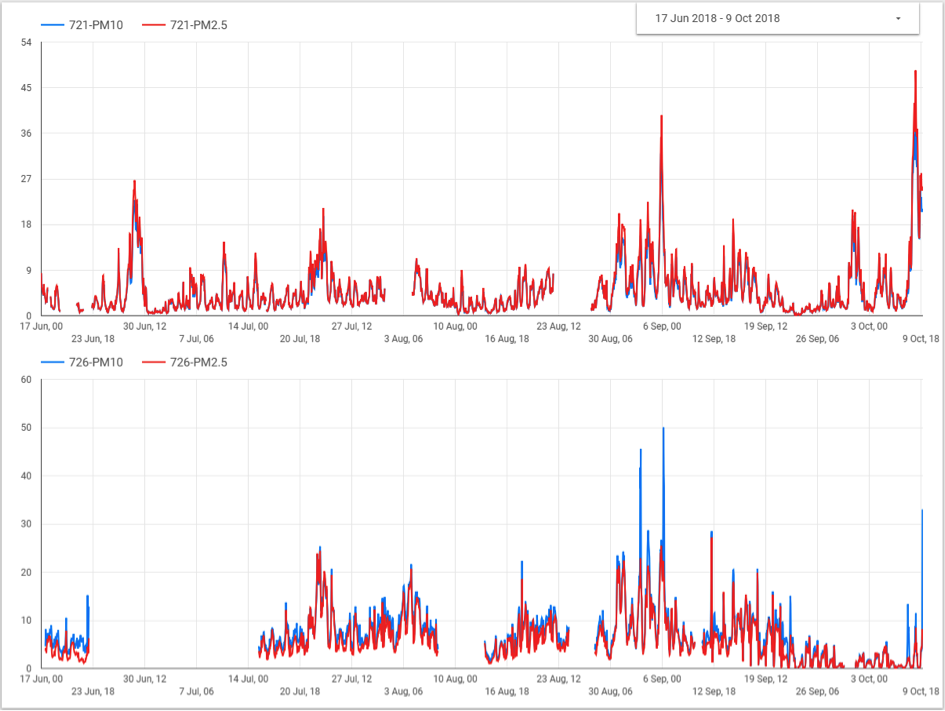
- You could also try two charts below each other. A data range control works for the whole page so put only one on the page.
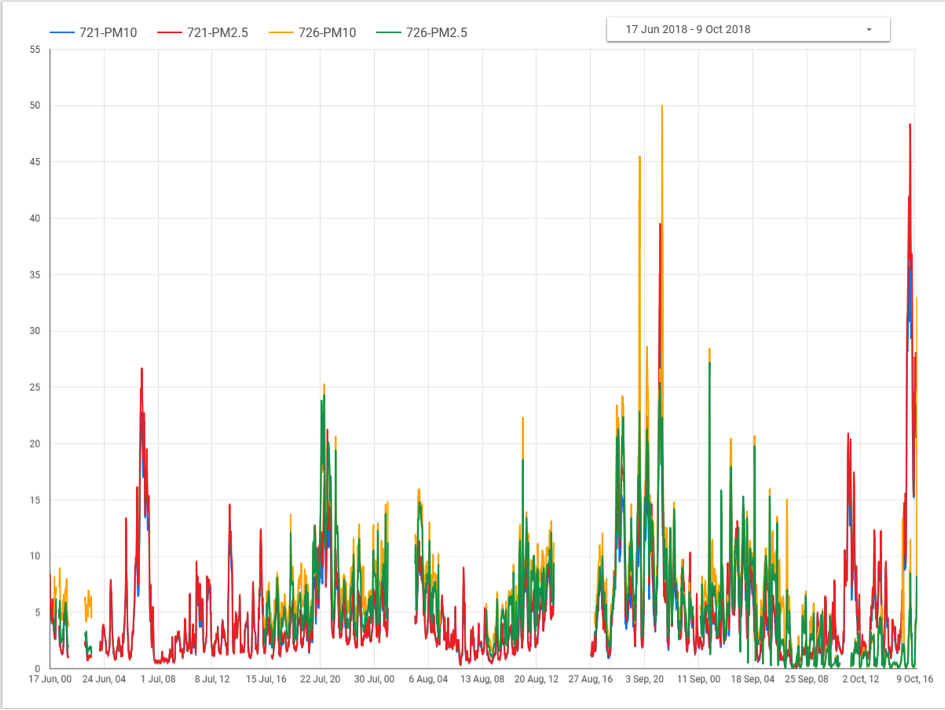
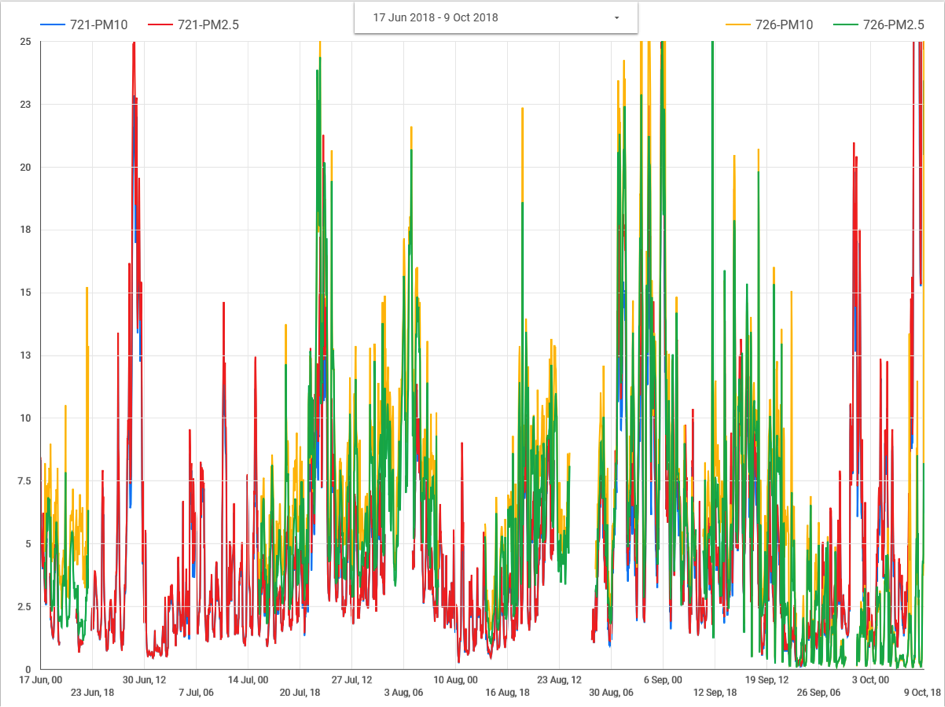
- Alternatively, you could overlay both charts, but you would then need to give both charts an identical fixed max value for the y-axis (also available in the theme settings).
For more data visualizations built on top of the hackAIR air quality data, see our overview post.