Did you know…
- that hackAIR calculates air pollution estimates for locations without measurements to create a continuous map in Germany and Norway?
- that it’s possible to estimate air quality using just a picture of the blue sky?
- that hackAIR uses machine learning algorithms to collect suitable images and can estimate the location where a sky photo was taken?
You can find more information about air quality estimation from sky images in an earlier blog post. Today, we want to introduce you to the following features:
- Data fusion mapping
- Image collection and analysis
hackAIR contributes to the growing field of participatory air quality sensing, with the aim to improve air quality data in Europe. hackAIR is accessible – citizens can choose their own level of contribution, reaching from a one-off, simple engagement to high involvement and long-term measurement and data analysis. Users who register on the hackAIR platform can see more features and have a more personalized experience: they receive personal recommendations depending on preferences chosen in their user profile.
Data fusion mapping
In hackAIR we collect mostly point-based observations, through air quality sensors and sky photos sky. For hackAIR users, we want to offer personalized information about air quality at every location and visualize these observations as a spatially continuous map.
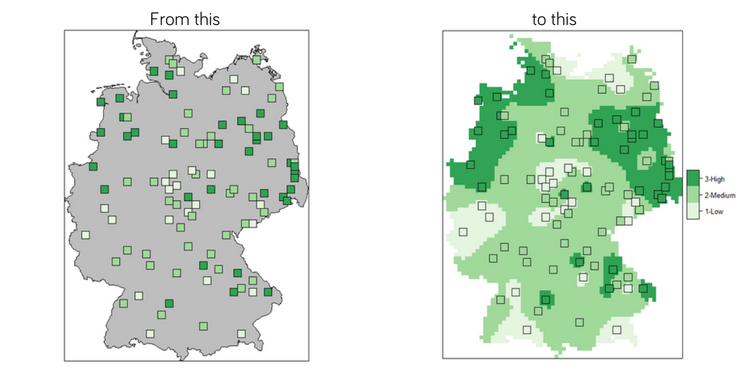
The data fusion module has been running since August 2017. It currently provides hourly updates of the average air quality for the last 24 hours. When we compared the module index with data of official measuring stations, we found a good correlation (R = 0.72, 74% correctly classified). We provide estimates for each 5x5km square in the target countries.
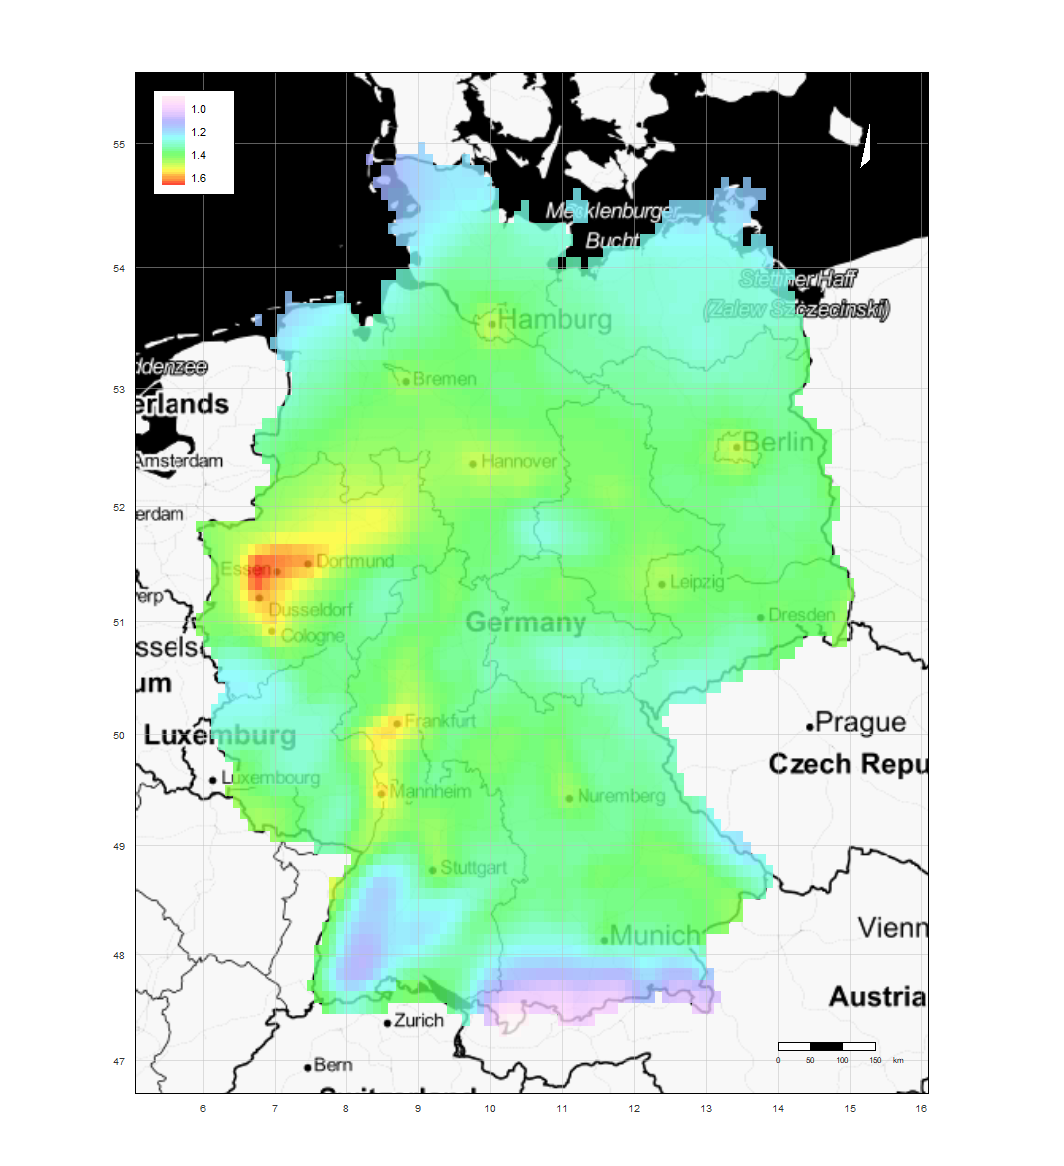 The image to the right shows the average air quality in Germany between September 2017 and February 2018 – overall a very realistic pattern. Pollution hotspots in the Ruhr area and other metropolitan areas are visible, and larger forests and nature reserves can clearly be identified.
On the hackAIR platform, the fusion map is currently hidden. Switch it on by clicking on the little balloon icon and zoom out enough to see the spatial patterns in Norway and Germany.
As mapping air quality at urban scale requires a dense network of sensors with high-quality data, NILU is planning experiments for Oslo later in 2018. The hackAIR pilot partner NILU has been offering workshops to citizens in Oslo to build their own sensor. This will allow to create a network of hackAIR sensors in Oslo in order to map the air quality on street-level.
In the video below, NILU’s Philipp Schneider explains the science behind hackAIR’s continuous air quality map.
Image data collection and analysis
hackAIR integrates several sources of air quality monitoring: official data, open data and APIs. Thanks to a good collaboration, hackAIR also shows the measurement of Luftdaten-sensors across Europe.
To supplement user-generated photos submitted through the hackAIR app, hackAIR collects sky images from Flickr and webcams. As there are many images on Flickr without a tag for location, the hackAIR team has developed a machine learning algorithm to estimate the location through using the image metadata (such as title, tags, description).
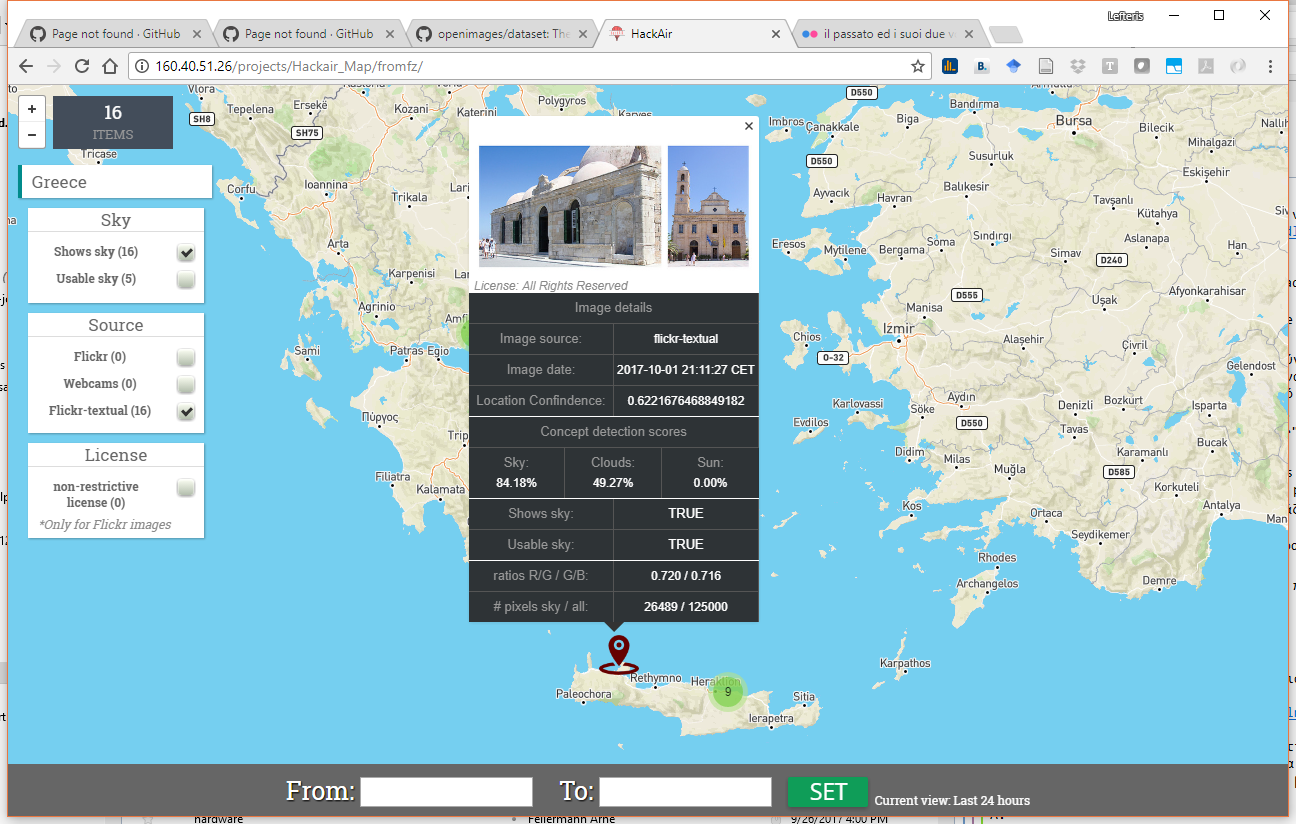
Image not geotagged but clearly from Chania/Crete/Greece! Tags: Chania, architecture, building, sky
In a second step, the algorithm detects the portion of blue sky in the photo. As the lower parts of photos often show buildings or landscape, this part is discarded by the hackAIR system. From the recognized sky, the upper third is used for further analysis.
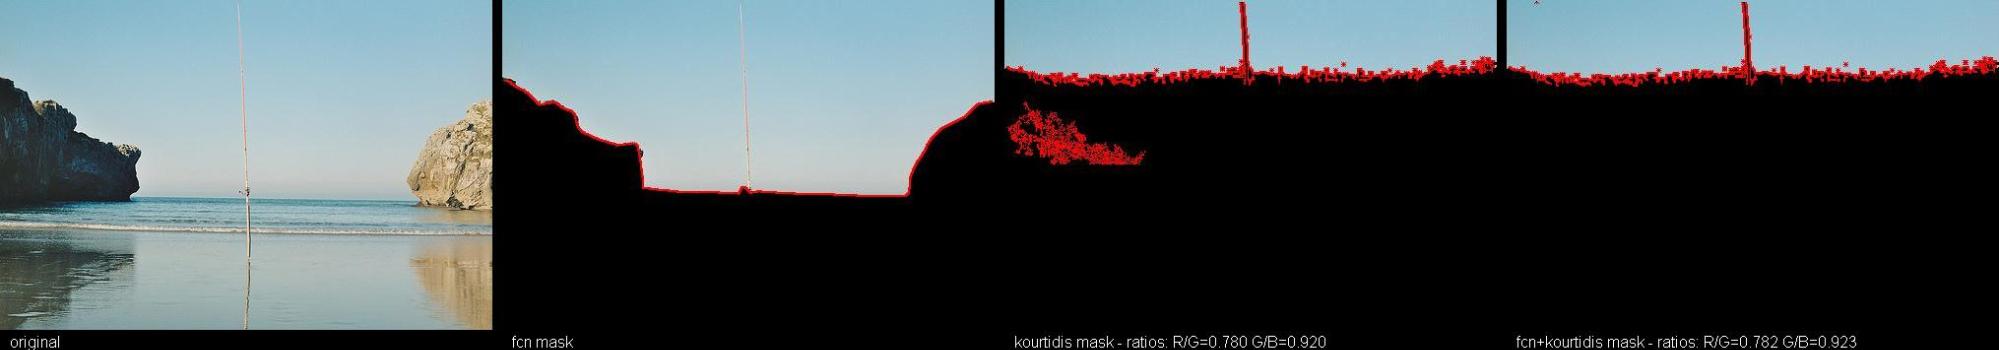
Sample sky detection using three different algorithms
In the video below, CERTH’s Eleftherios Syromitros-Xioufis explains the science behind hackAIR’s image data collection and analysis.
Want to try out hackAIR’s air quality detection from sky images? Download the app and upload a picture of the sky near you to get an estimate.